Creating Widget
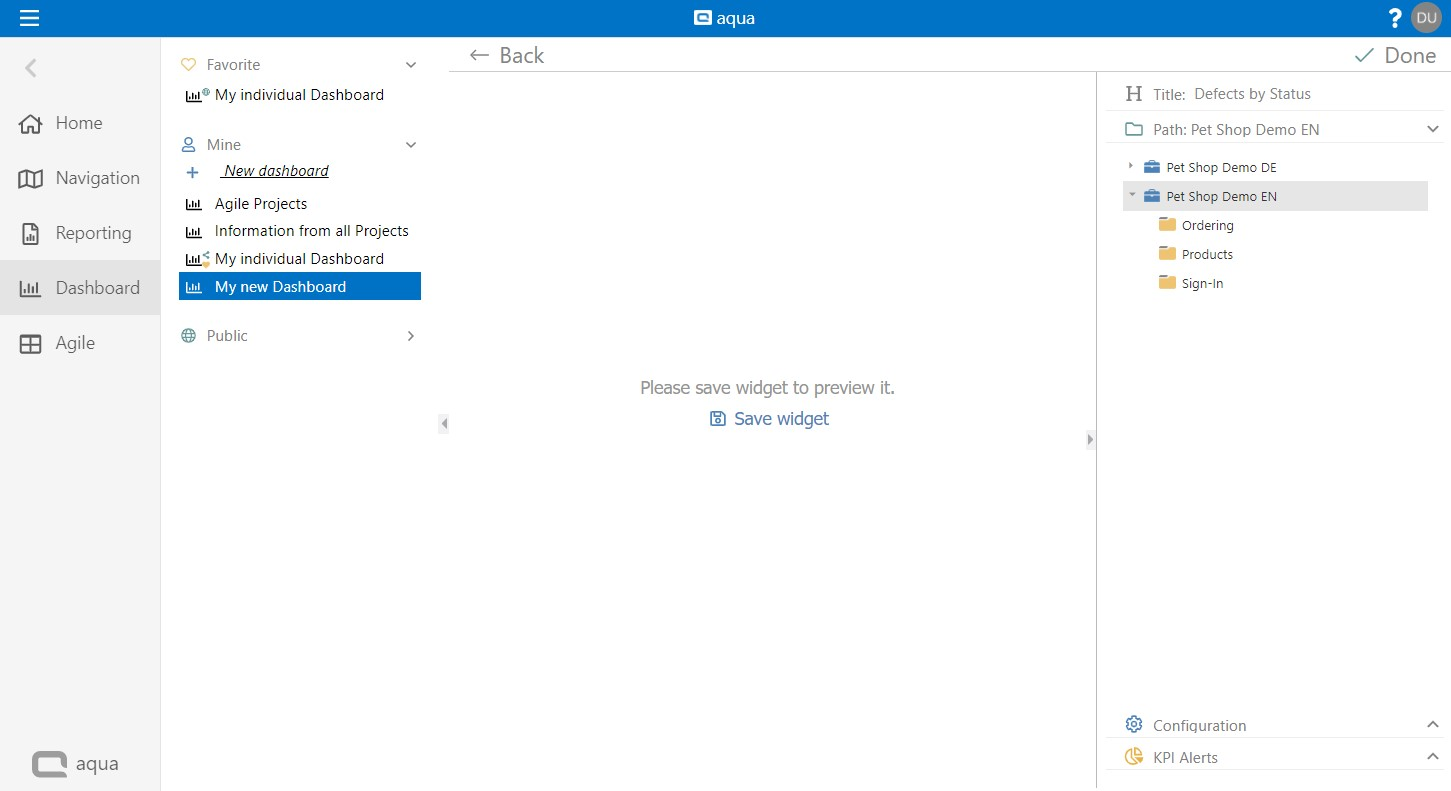
To add a widget, click on Add widget in the middle of the screen if it is a new dashboard, or on the plus  button on the top right. Give it a title and choose the project or a sub folder for the data to be considered.

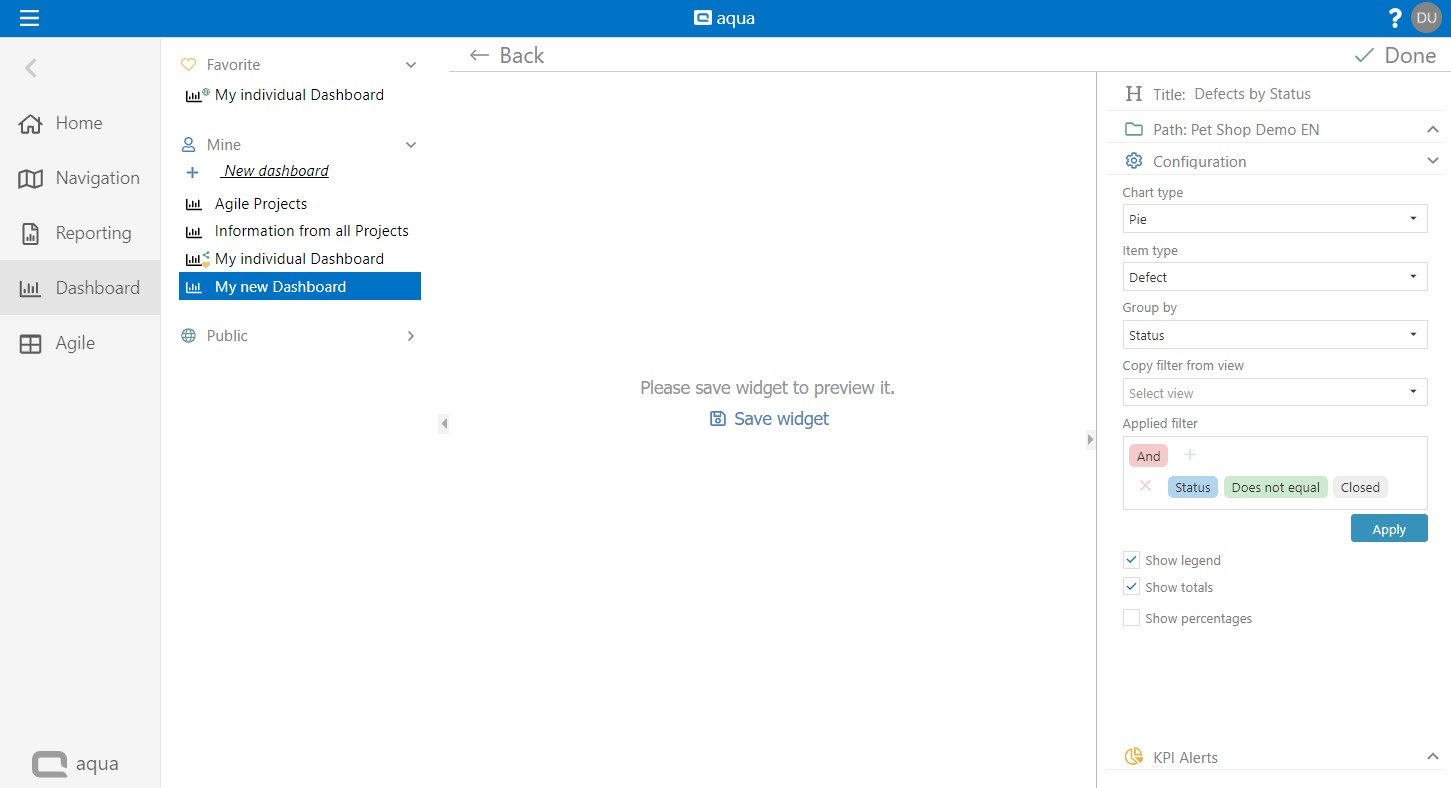
Click on Configuration to define the chart. Select a chart type and an item type. Now define the Group by field and choose a filter if you need one.
Additionally you can define if the legend, the sum of all items and percentages should be displayed.

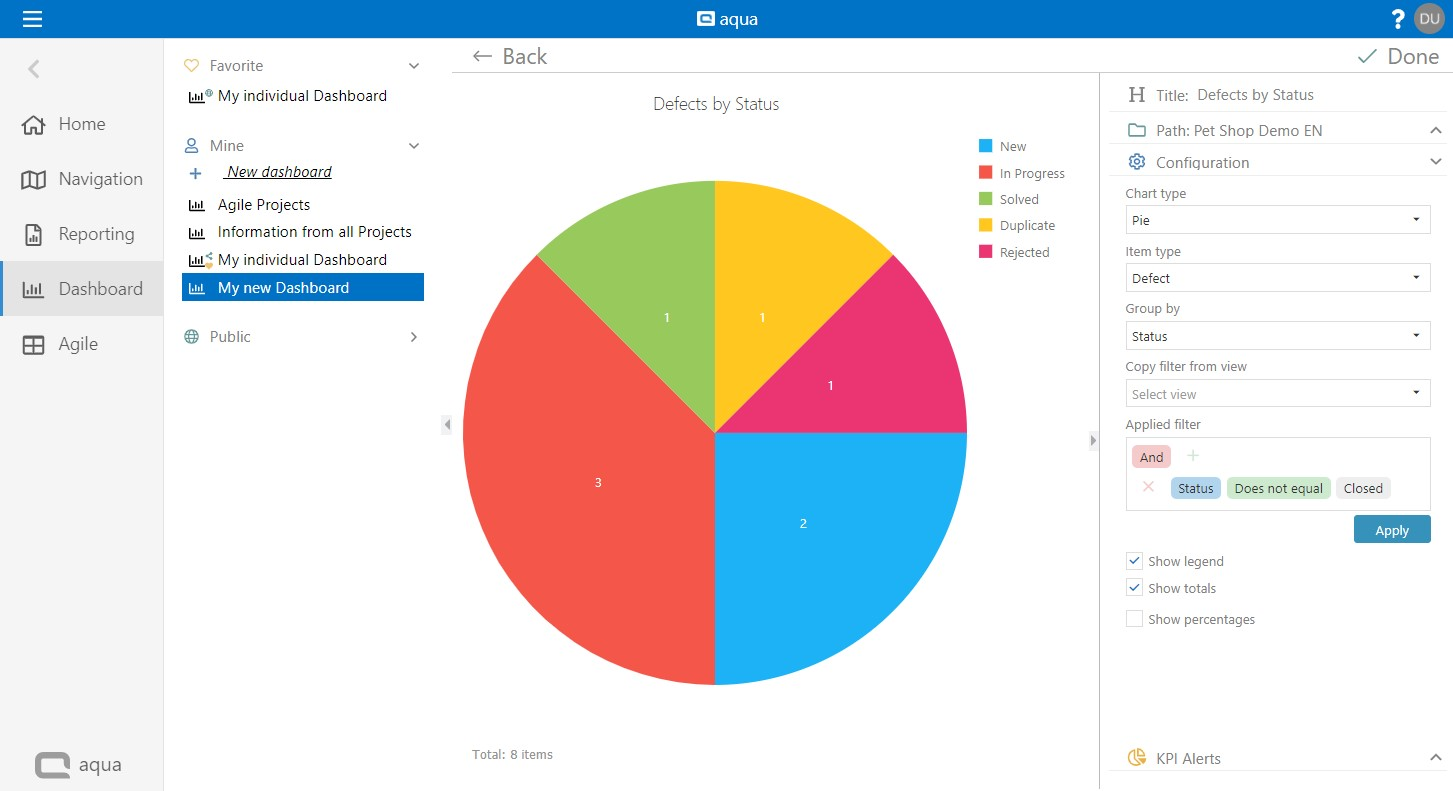
Click Save widget to save the widget and get a preview.

The Back button takes you back to the general view of the dashboard. You can also use KPI Alerts to adjust the colors of the dashboard.
Related Articles
Configure Widget
Move the mouse over a widget. A Mouse Over menu appears, which allows you to delete, configure (edit), duplicate, copy or maximize the diagram.Creating a Dashboard
To create a dashboard click on New dashboard on the left hand side. Now, choose a name for you new dashboard. On the top right, you can find settings for your dashboard. Button Function Mark dashboard as favorite Change size of widgets Add widget ...Creating a Report
The report is created based on the information within the currently selected project folder or subfolder. The list of available reports depends on the amount of templates stored within the current selected project. Report templates can be used in ...Creating and Editing Items
New items, such as requirements, test cases, test scenarios or defects can be easily created using the New button in the upper left corner of the ribbon in the navigation module. The item will be created in the currently selected folder of the ...Creating a new report template
To create a new report it is important to decide which data you want to use as a basis. You can decide to base your report on requirements, test cases, test scenarios, or defects. The layout designer will not be affected by your choice, only the ...