Logs
In some cases aqua support will ask you for your server or client logs. You can find them in the following paths (in default installations):
Client Log
%localappdata%\andagon_GmbH\aqua\logs
Server Log
C:\Program Files\andagon GmbH\aqua For IIS\aqua\Logs
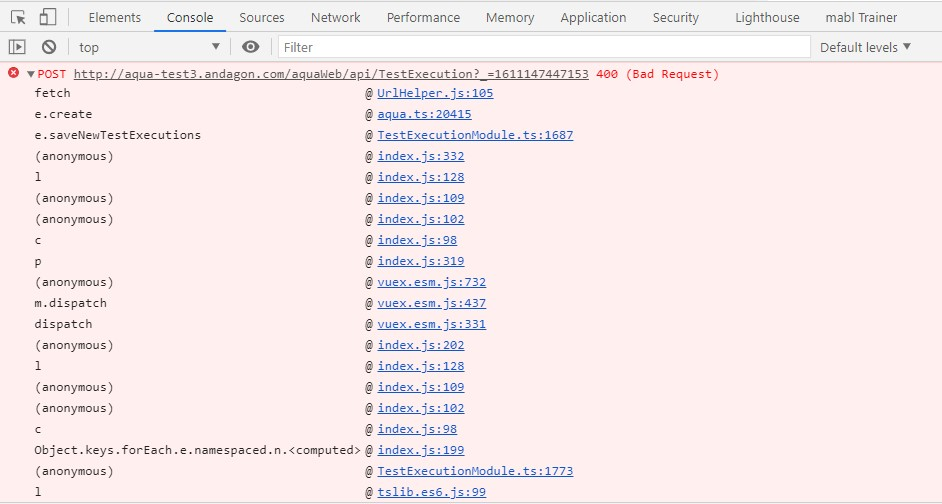
If errors occur in the web browser (e.g. a JavaScript Error), you might also be asked to look in the developer console for further analysis. The developer console can be opened in most browsers via the F12 key. You may have to switch to the "Console" tab. In Firefox you can also get to the console directly with the shortcut 'Ctrl+Shift+k'. In Chrome via the shortcut 'Ctrl+Shift+j'. The Network Analysis tab may also be needed by the aqua support for further analysis.

Related Articles
Windows Event Log
If there is no error message regarding your problem visible in your aqua logs, please have a look at your windows event log. To reach this you need to follow these steps: 1. Press the 'Windows-Button' to open the search bar 2. Enter 'Event Log' and ...Release Notes 23.70.0 - SaaS
Release notes Version 23.70 Includes all changes since version 23.46 New features and improvements: RQ049277 - AI | Narrate the ideas and convert speech to a requirement RQ049344 - AI | Test case generation | Save context once they are provided by a ...Troubleshooting
Self-signed certificate Jira can be configured to support secure connections via HTTPS. In this case, all HTTP requests are redirected by Jira to HTTPS. When a self-signed certificate is used by Jira, the Jira sync and also the sync configurator can ...Users
To see all information with respect to a single user, you can select him from the list or enter the name in the search bar. Adding Users For adding a new user, press button Add User from the Ribbon Bar on top of the window. A user dialog will allow ...Basic synchronization
Download SyncConfigurator You can download the SyncConfigurator from your server landing page. Start the download by clicking the corresponding link on the page. Save the download and execute the .msi file. You will now start the installation of the ...